> For AI agents: the complete documentation index is available at /llms.txt, the full documentation bundle is available at /llms-full.txt.
# Compile overall
## Overview
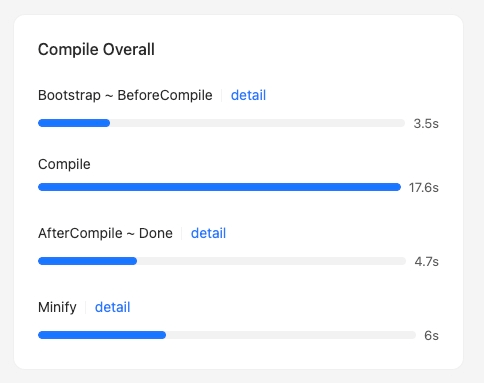
On the homepage of **Rsdoctor**, there is a card called `Compile Overall` that provides information about the **compilation process** of the current project. The content is shown in the following image:
:::tip
For each compilation phase, if the time data is displayed in blue
, it means that you can click to view the detailed time breakdown
.
:::
## Glossary
The following table explains the meaning and code implementation of each phase in the card:
| Phase Name | Description | Code Implementation |
| ---------------------------------------- | ------------------------------------------------------------------------------------------- | --------------------------------------------------------------------------------------------------------------------------------------------------------------------------------------------- |
| Bootstrap -> BeforeCompile | Represents the time taken from project startup to before compilation starts | - Reports [process.uptime()](https://nodejs.org/dist/latest-v22.x/docs/api/process.html#processuptime) as the duration when **compiler.hooks.beforeCompile** is called
|
| Compile | Represents the total time taken for the project compilation | - The start time is the time when **compiler.hooks.beforeCompile** is called, and the end time is the time when **compiler.hooks.afterCompile** is called
|
| AfterCompile -> Done | Represents the time taken from compilation completion to the end of the entire process | - The start time is the time when **compiler.hooks.afterCompile** is called, and the end time is the time when **compiler.hooks.done** is called
|
| Minify | Represents the time taken for file compression during the compilation process in most cases | - Calculates the sum of the time taken for each call of **compilation.hooks.optimizeChunkAssets** and **compilation.hooks.processAssets**
|
## Usage instructions
### Bootstrap -> BeforeCompile details
By **clicking on the data of the `Bootstrap -> BeforeCompile` phase**, a popup will appear on the page, as shown in the following image:
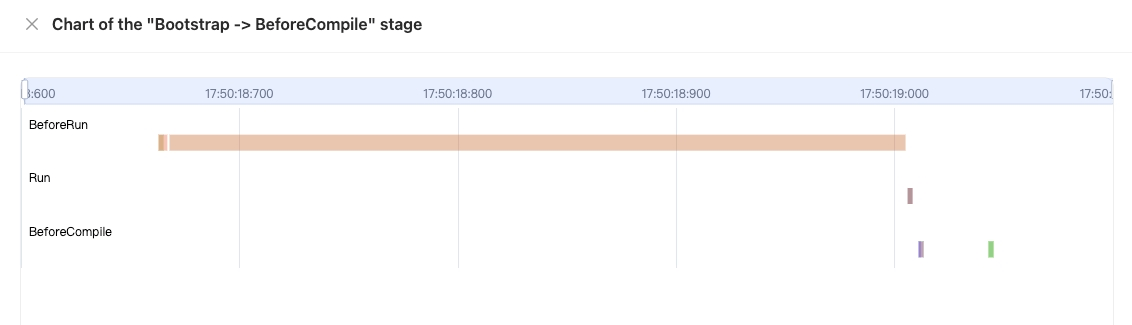
The popup mainly contains a chart:
- The **x-axis** represents **time**
- The **y-axis** represents all the **hooks** that have been **tapped by plugins** before the **compiler.hooks.beforeCompile** is called
- The data in the chart represents the **start and end time** of each **hook**.
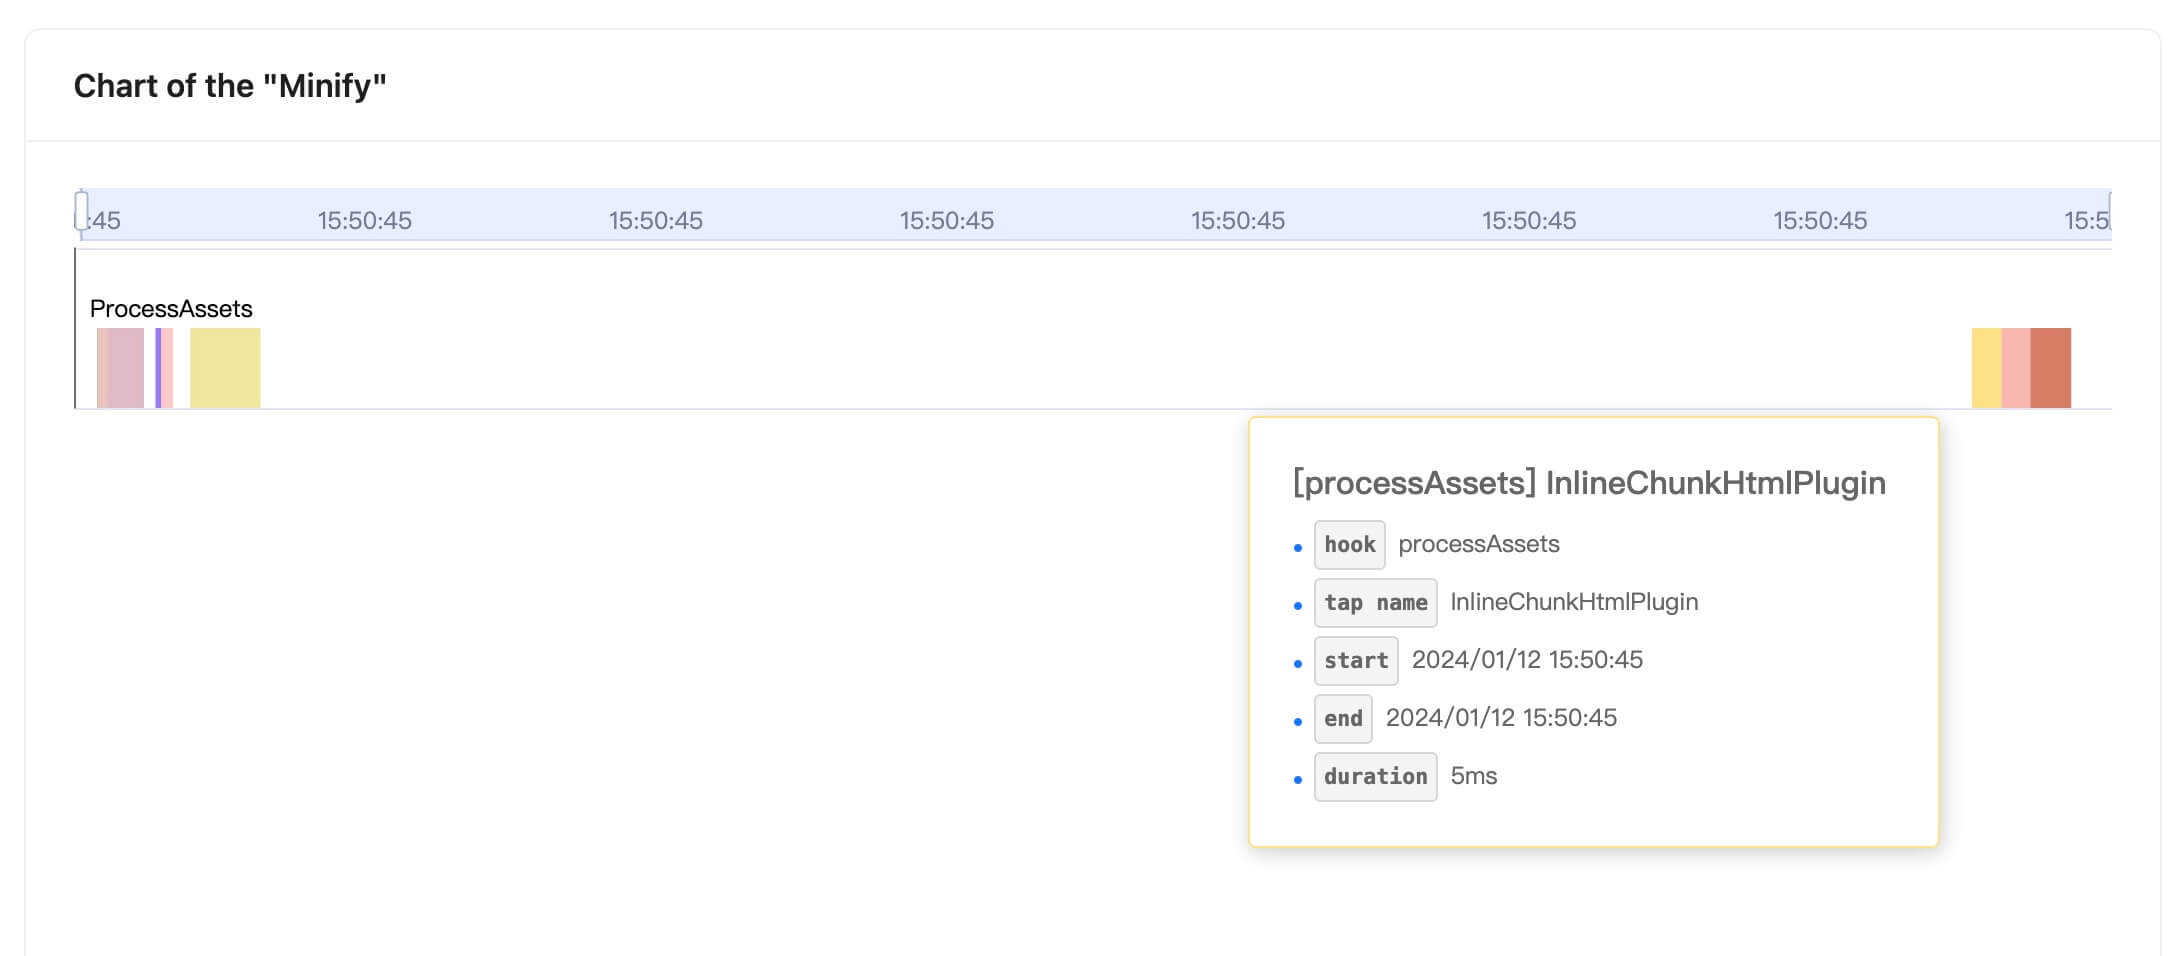
Hovering over a data point in the chart will display the following information in a tooltip:
- **hook**: the name of the hook
- **tap name**: the name value when [.tap](https://github.com/webpack/tapable#hookhookmap-interface) is called
- **start**: the start time
- **end**: the end time
- **duration**: the duration, calculated as `end - start`
### Compile phase
In this section, you can navigate to "Compile Analysis" -> "Loader Analysis" -> [**"Loader Timeline"**](/guide/usage/loaders-timeline.md) in the navigation bar to view the timeline of loader compilation time.
### AfterCompile -> done details
By **clicking on the data of the `AfterCompile -> Done` phase**, a popup will appear on the page, as shown in the following image:
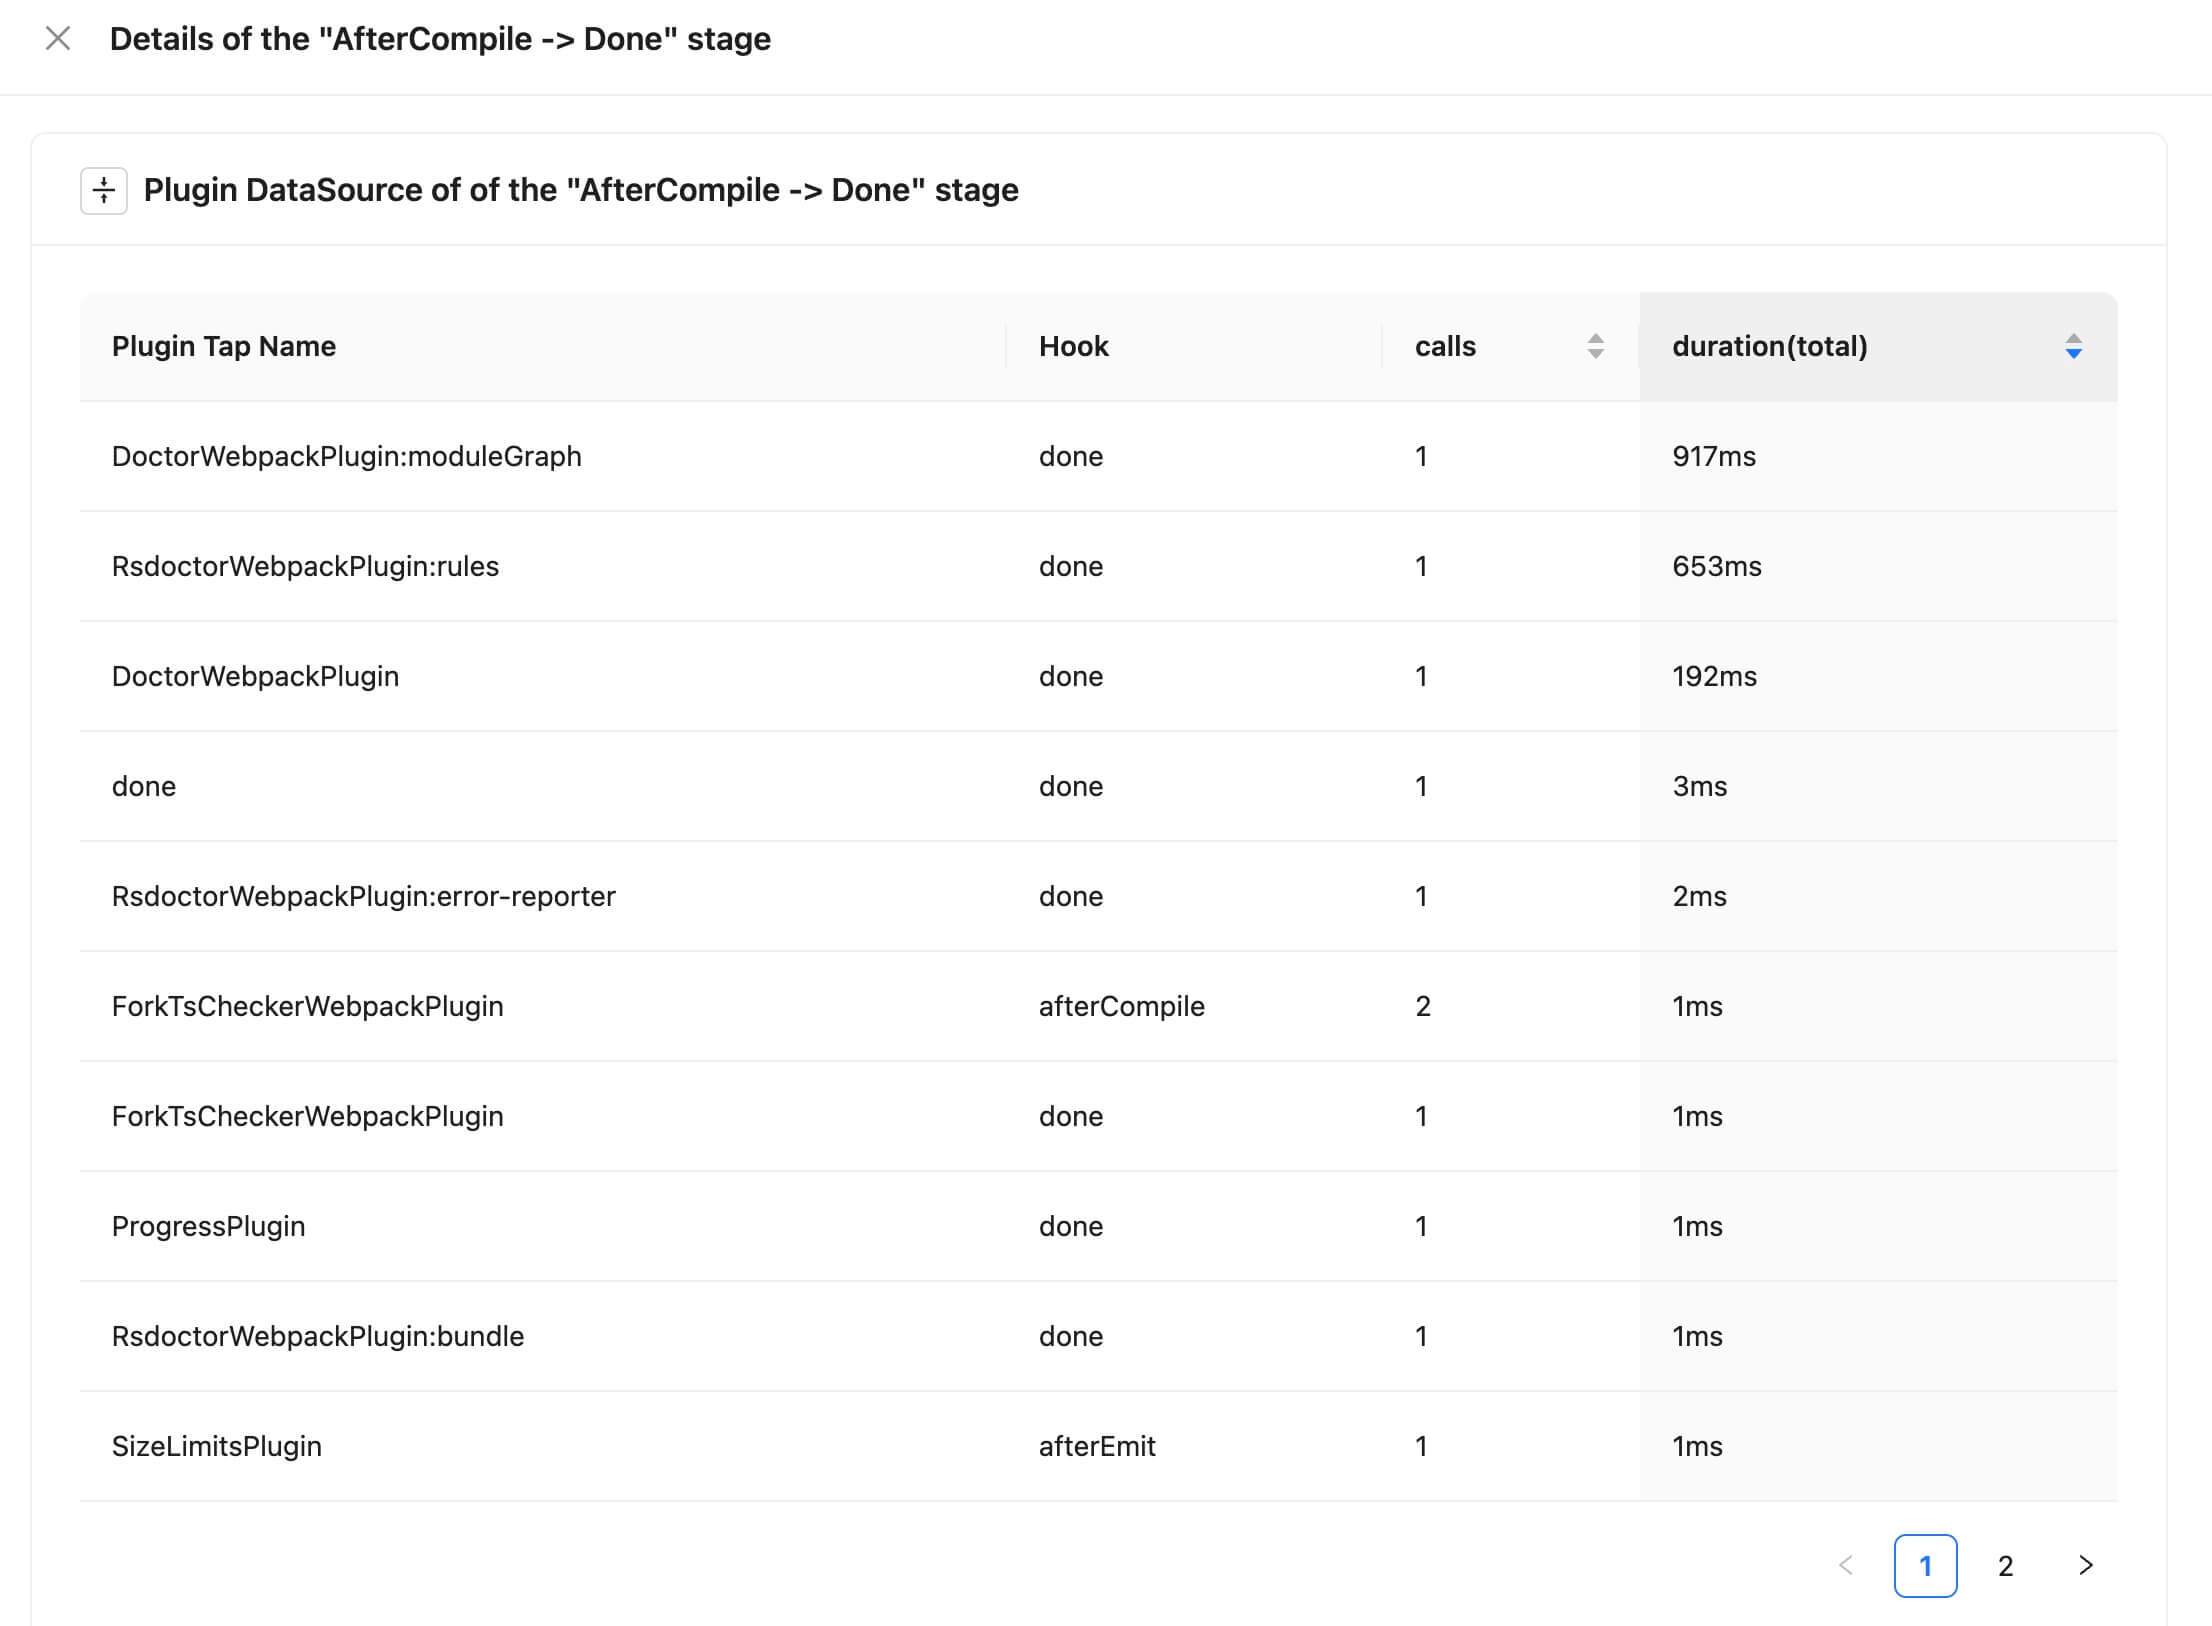
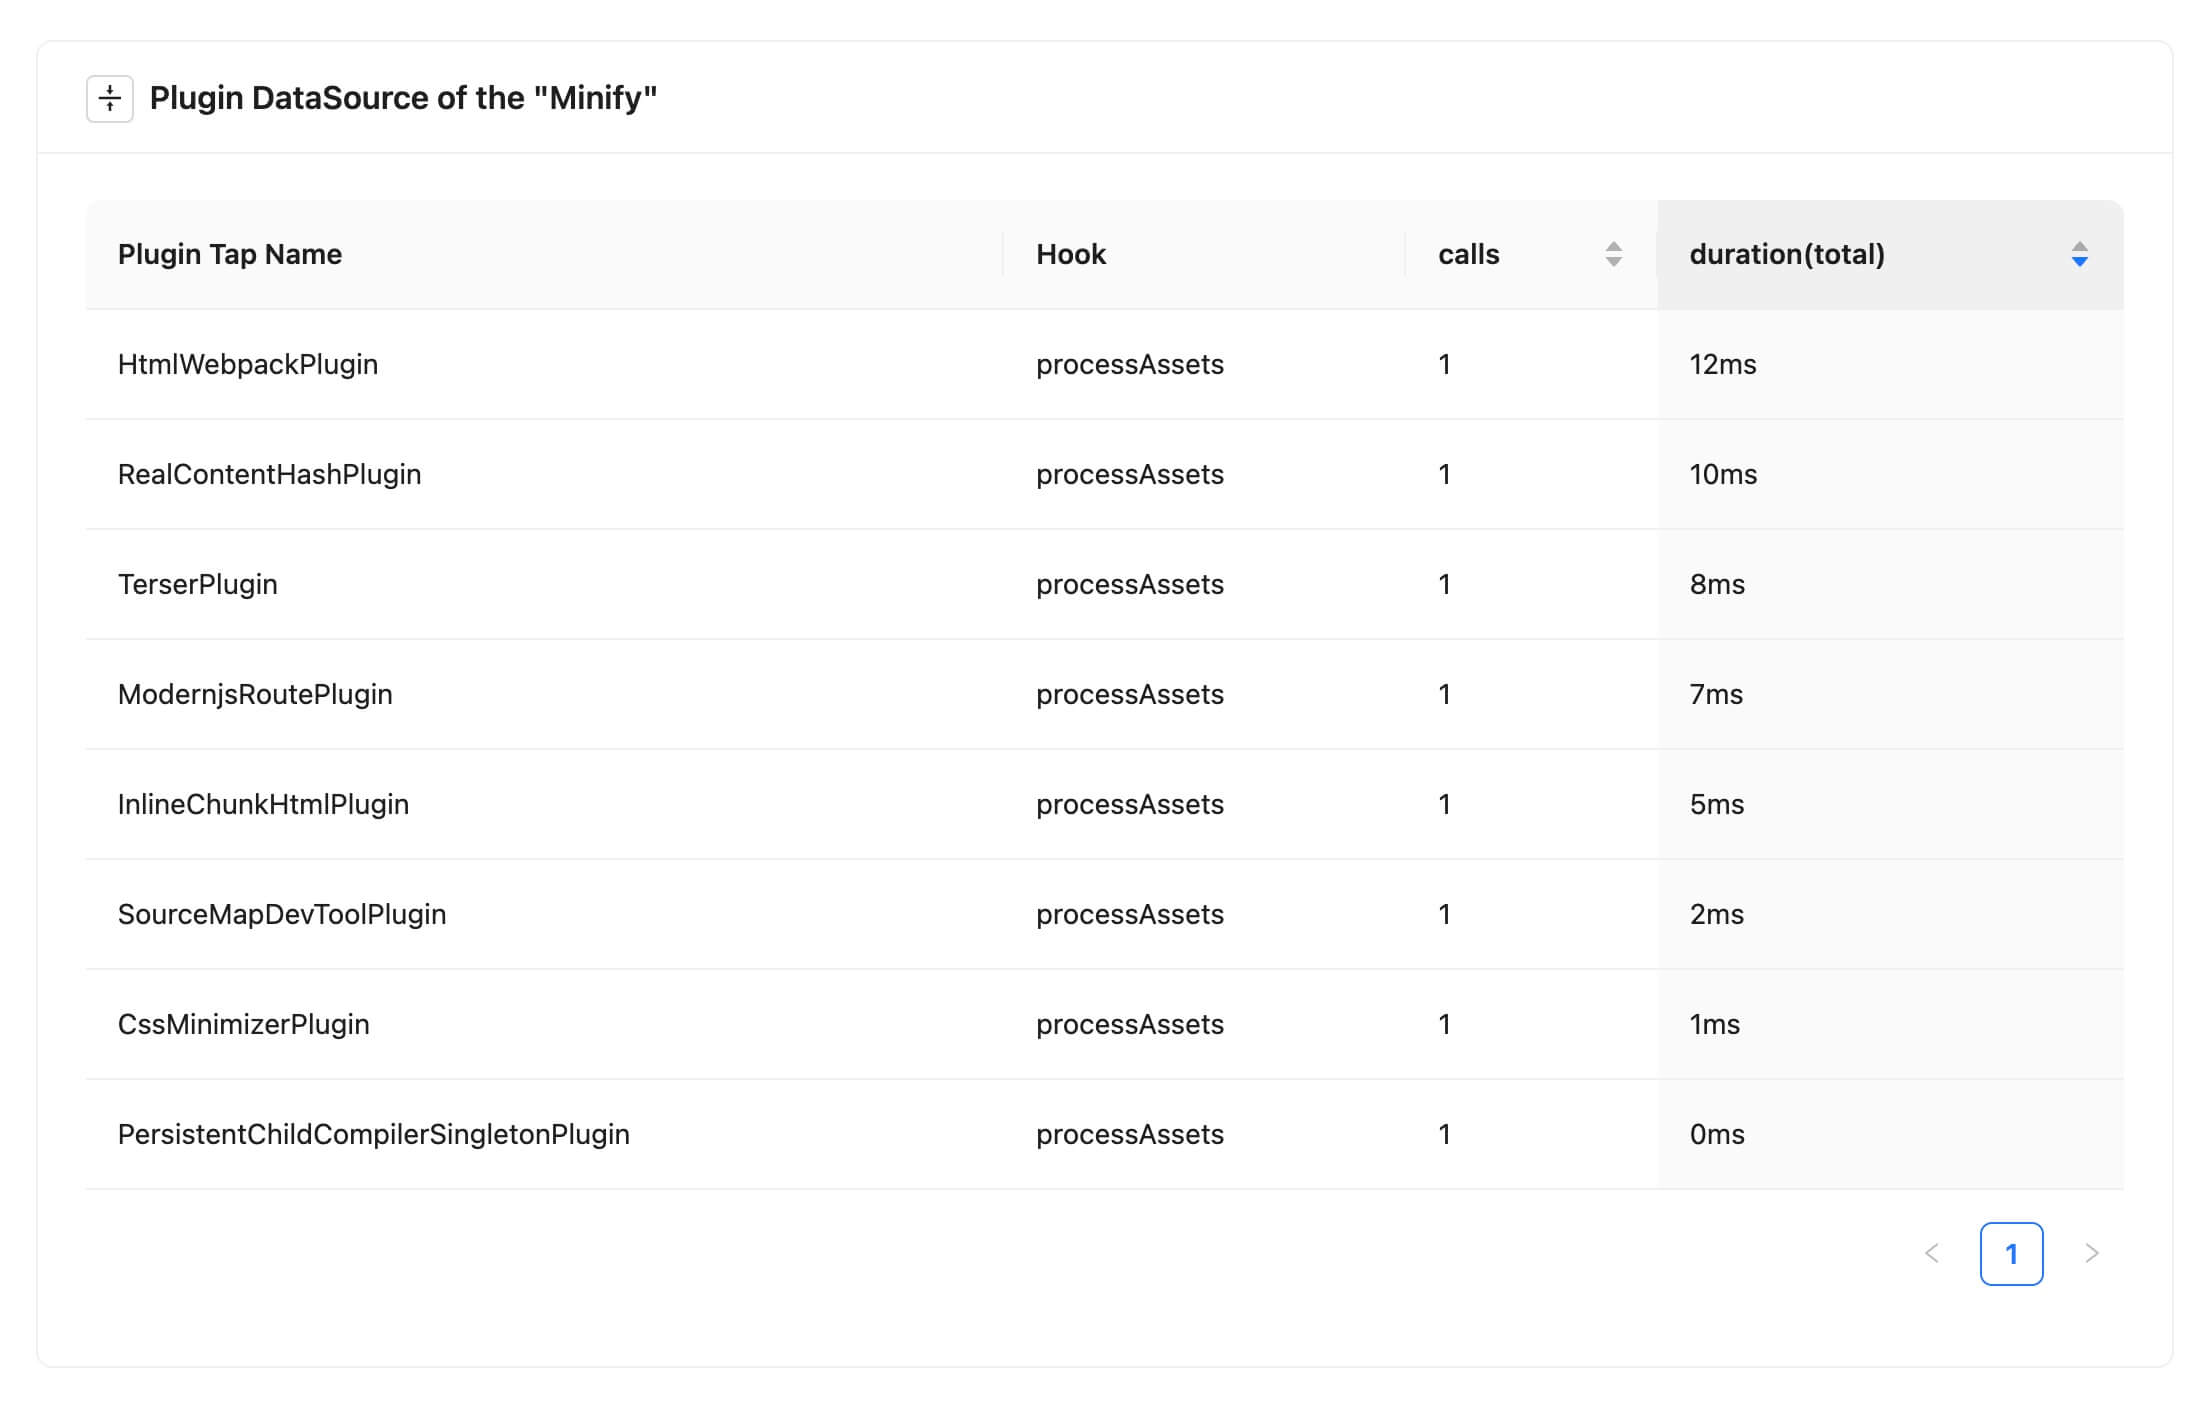
The popup mainly contains a data table that shows the relevant data of the calls. The field meanings are as follows:
- **Plugin Tap Name**: the name value when [.tap](https://github.com/webpack/tapable#hookhookmap-interface) is called
- **Hook**: the name of the hook
- **calls**: the number of times the hook is called
- **duration(total)**: the total time of all the calls
Scrolling down the page will show the corresponding chart:
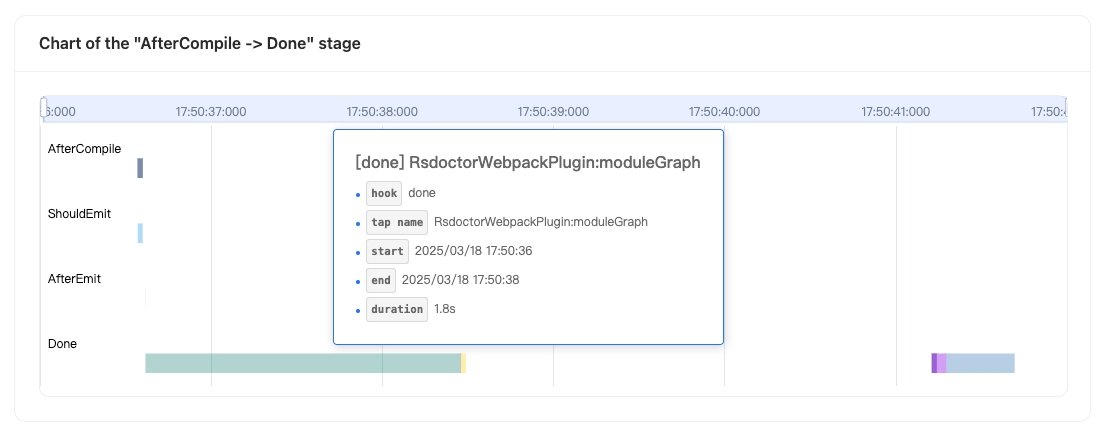
The chart shows:
- The **x-axis** represents **time**
- The **y-axis** represents all the **hooks** that have been **tapped by plugins** between **compiler.hooks.afterCompile** and **compiler.hooks.done**
- The data in the chart represents the **start and end time** of each **hook**.
Hovering over a data point in the chart will display the following information in a tooltip:
- **hook**: the name of the hook
- **tap name**: the name value when [.tap](https://github.com/webpack/tapable#hookhookmap-interface) is called
- **start**: the start time
- **end**: the end time
- **duration**: the duration, calculated as `end - start`
### Minify details
:::tip
Minify details are currently not available for Rspack projects.
:::
By **clicking on the data of the `Minify` phase**, a popup will appear on the page, as shown in the following images:
|  |
|  |
| ------------------------------------------------------------------------------------------ | ------------------------------------------------------------------------------------------ |
The content in the popup has similar meanings to the previous paragraphs, so it will not be repeated here.
## Reference documentation
- [**Rspack Hooks**](https://rspack.rs/api/plugin-api/compiler-hooks#beforecompile)
|
| ------------------------------------------------------------------------------------------ | ------------------------------------------------------------------------------------------ |
The content in the popup has similar meanings to the previous paragraphs, so it will not be repeated here.
## Reference documentation
- [**Rspack Hooks**](https://rspack.rs/api/plugin-api/compiler-hooks#beforecompile)